Sea level adaptation decisions under uncertainty in Bergen
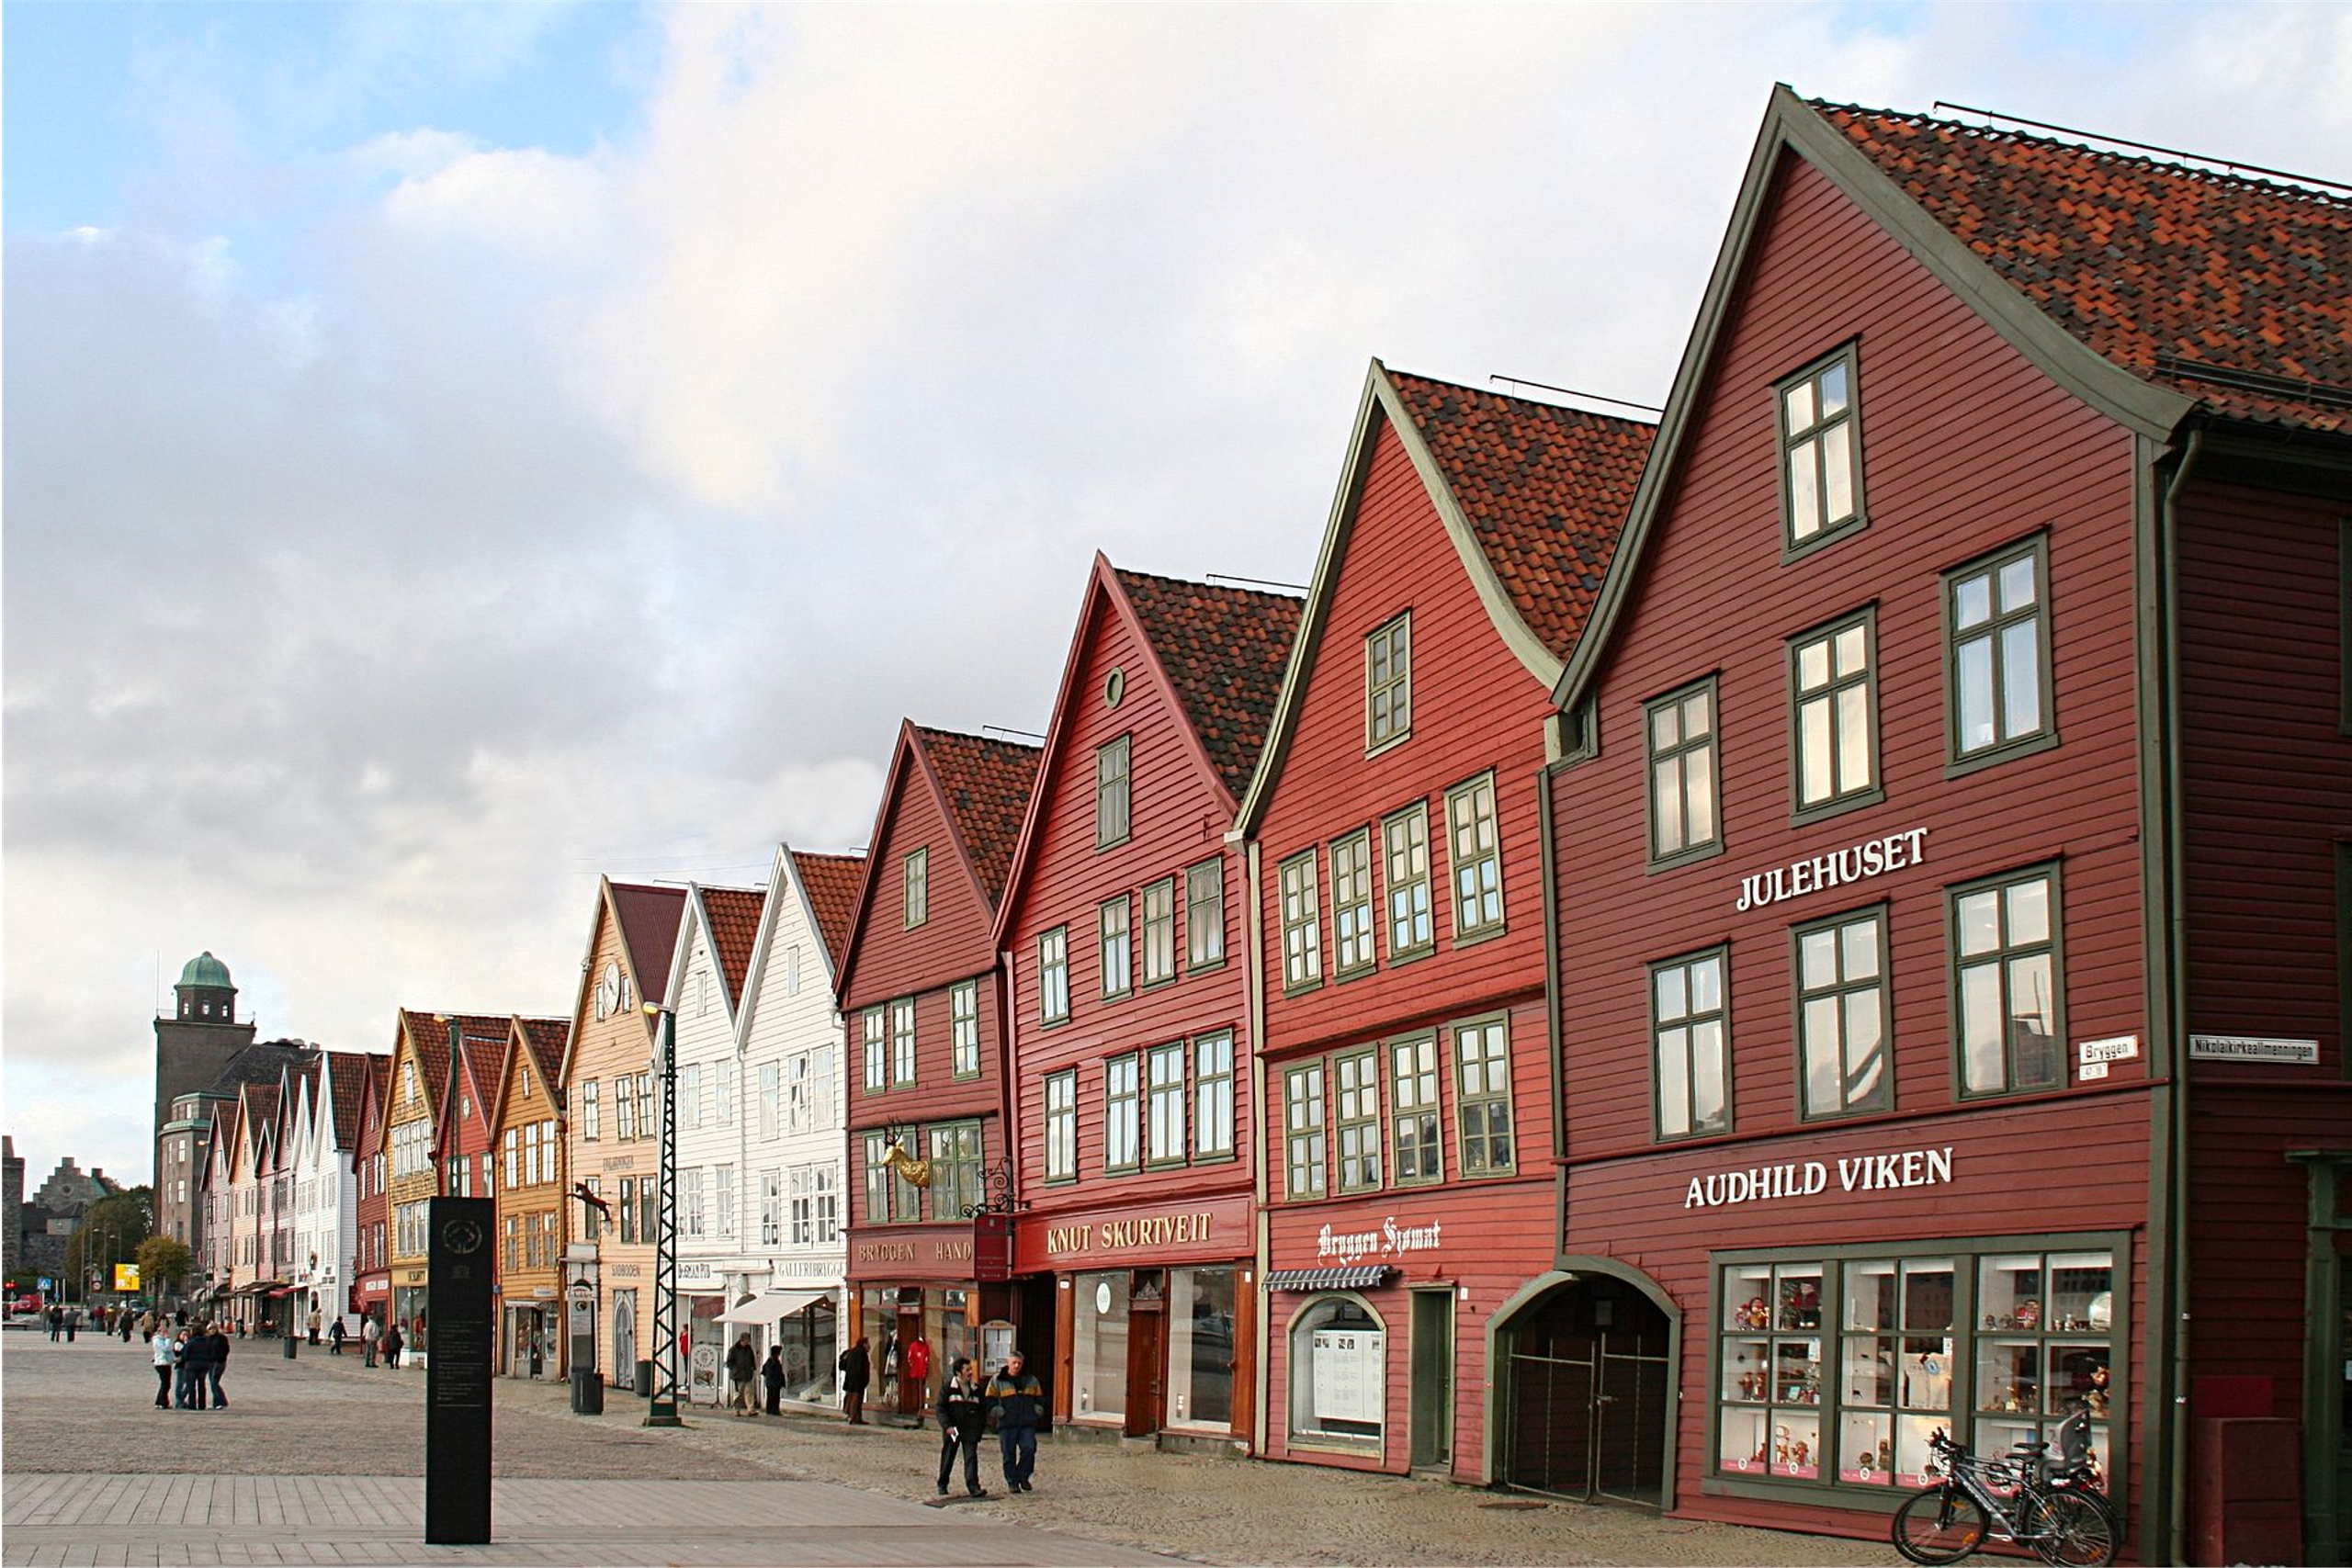
Picture taken from Wikipedia
Sea level rise poses a threat to the Norwegian coastal city of Bergen and its historic harbor. The threat could be reduced, but greater flood protection comes at greater cost. Adapting to sea level rise requires comparing different possible adaptation strategies, comparing the cost of different actions (including no action), and assessing where and at what point in time the chosen strategy should be implemented. All these decisions must be made under considerable uncertainty-in the amount of sea level rise, in the damage costs, how the sea level rise effects the damage costs and prioritization of adaptation actions, and in the implications of no action. We have a model taking different uncertainties into account. We try in this application to illustrate some of the results obtained. The model and the modeling assumptions are discussed more in detail in a paper in
Water Resources Research
and in a paper in
Significance.
The Bergen municipality has thought about some intervention measures. One is to build an outer barrier protecting the entire Bergen fjord and another one is to build two smaller barriers, farther in towards the actual harbor. The cost of the outer barrier is about NOK 34 billion (about GBP 3.1 billion or EUR 3.5 billion) and for the inner barriers, about NOK 1.1 billion (about GBP 99 million or EUR 111.6). As previously mentioned, which option to pursue depends on many factors.
When calculating the cost of different actions, the damage costs should be calculated. There are different sources of uncertainty when calculating the damage costs. First, there is uncertainty in the sea level rise, which is linked to climate change. We consider three scenarios of climate studied in the climate change science, called RCP 2.6, RCP 4.5 and RCP 8.5 respectively. The RCP scenarios give different trajectories for the concentrations of greenhouse gases, where RCP 2.6 predicts the lowest concentrations and RCP 8.5 predicts the highest concentrations (for more details, see e.g.
CoastAdapt
). We have developed a model relating the RCP scenarios to the local sea level rise in Bergen. Second, there is uncertainty in the annual damage costs due to storm surge damage, not considering climate change. The sea level rise will also effect the damage costs. All of these uncertainties are taken into account in our model.
In the section "Figure: Total damage costs in Bergen" we try to illustrate how the damage costs depend on the timing of the adaptation measure consisting of the two inner barriers.
In the section "Figure: Total costs when there are no adaptation measures" we show the total accumulated damage costs for 2016-2010 without any adaptation measures for different uncertainty assumptions. We see that failing to consider uncertainty can result in the median-projected damage costs being an order of magnitude smaller.
Total damage costs in Bergen for the period 2016-2100 as a function of the timing of the adaptation measure
The blue bars show the 90 % confidence intervals of the damage costs in Bergen in the period 2016-2100 due to storm surges. We also assume the two inner barriers are built and these will provide partial protection from the storm surges. The year when the inner barriers are built is varying. We assume the barriers give protection from a given year and onwards. We add the cost of the barriers to the damage costs for the year the barriers give protection from. Aftwerards the damage costs will drop. For instance, if the barriers are built in 2020, the 90 % interval for the aggregated damage costs is about [1,3.1] billion NOK. All the stated uncertainty sources in the "Main page"-section are accounted for, i.e. uncertainty in yearly aggregated damage costs due to storm surges, uncertainty in the sea level rise under a given RCP-scenario and uncertainty in the increase of the yearly aggregated damage costs due to increased sea level.
The blue line segments give the median of the total projected damage costs, which depends on the year the barriers are built. The black dotted lines give the 90 % confidence intervals for the aggregated damage costs in the period 2016-2010 when no action is taken and the black line give the median.
In the panel to the left of the plot, you can select RCP and also select what to be shown in the plot. In the summary-tab, you can see when to build the barriers based on different risk functions.
Total costs when no adaptation measures are built and taking different sources of uncertainty into account
NB: x-axis is on log-scale
For a given RCP-scenario, we calculate the median and 90 % of the total damage costs for 2016-2100 when there are no adaptation measures and when we consider different uncertainty scenarios/assumptions. The following quantities can vary: (1) the yearly damage costs (where no increase due to climate change has been accounted for), (2) local sea level rise and (3) how the sea level rise effects the yearly damage costs. The different asummptions are
(a) Black vertical line: We do not consider uncertainties in any of the uncertain quantities, but use median values for each year of each of them and then calculate the sum.
(b) Green bar and green vertical line: Here we fix (2) and (3) at their yearly median and only allow (1) to vary. The green bar is the 90 % interval and the vertical line is the median.
(c) Orange bar and vertical line: We allow (3) to vary and fix (1) and (2) at their median.
(d) Purple bar and median line: We allow (2) to vary and fix (1) and (3) at their median
(e) Blue bar and vertical line: We allow all factors to vary.